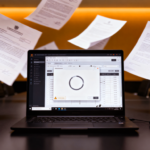

It was just a few minutes before the meeting started. The presentation was ready, contract negotiations were at an advanced stage, and the client was already in the virtual meeting room.
That was exactly when the system slowed down.
The screen took forever to load, the file would not open, and a corporate application froze just as the team needed to retrieve a simple piece of information to answer the client with confidence.
There was no complete outage, no critical alert was triggered, and the application never went offline. From a technical standpoint, the environment might still have been considered “available.” But for the people in the meeting, the impact was clear: delays, improvisation, uncertainty, frustration, and a loss of client confidence.
Situations like this happen every day in organizations of all sizes. The system does not fail completely, but it becomes slow enough to disrupt a meeting, delay a proposal, affect customer service, or undermine a client relationship.
When IT monitors only for downtime, many of these issues go unnoticed. And when users can only report that “the system is slow,” IT often lacks the data needed to understand where the bottleneck actually lies.
Why Do Corporate Systems Slow Down for No Apparent Reason?
From the user’s perspective, the problem may seem simple: “the system keeps freezing.” For IT, however, the root cause may lie across multiple layers.
The application may be consuming more resources than expected. The network may be unstable at a specific location. The employee’s endpoint may be underperforming. Remote access may be introducing latency, or authentication processes may be taking longer than they should.
Usage patterns can also contribute to performance degradation, particularly during peak periods when many employees access the same system simultaneously or rely on complex integrations to complete critical tasks.
The challenge is that these factors do not always appear clearly on traditional dashboards. A server may be available, the application may respond successfully to basic health checks, and the connection may remain within acceptable parameters—even while the end-user experience is poor.
Where Could the Bottleneck Be?
System slowness is rarely an isolated event. It is often the result of several smaller bottlenecks across the employee’s end-to-end digital experience, including:
- Application: Resource constraints, integration failures, performance degradation, or increased response times during peak usage periods.
- Network: Instability related to a specific location, connection, route, or access point.
- Endpoint: A laptop or desktop that is no longer delivering the performance required for day-to-day work.
- Remote Access: Latency or instability related to VPNs, authentication processes, access policies, or other remote connectivity mechanisms.
- Workflows and Tool Usage: Complex digital workflows or tool combinations that increase the time and effort required to complete a task.
A problem may begin during login, continue as the application loads, involve both the network and the endpoint, and still appear to the employee as nothing more than an unresponsive screen.
Without visibility across this end-to-end experience, IT receives a generic complaint: “it’s slow.” And a generic complaint rarely points directly to the root cause.
How Application Slowness Impacts Productivity and Revenue
When a corporate application performs poorly, the impact extends far beyond a few lost minutes:
- A sales team that takes too long to retrieve information during a negotiation can lose momentum.
- A customer support team waiting for systems to load increases response times for customers.
- A finance team facing instability in a critical application may delay validations, approvals, and closing processes.
- A manager who cannot access the right information at the right moment may be forced to make decisions with less confidence.
Poor performance also changes user behavior. Employees begin creating workarounds—exporting spreadsheets, saving files outside official workflows, using shadow IT, postponing updates, avoiding specific tools, or seeking informal support instead of opening tickets.
Over time, the issue is no longer purely technical. It begins to affect processes, governance, productivity, and operational performance.
The most critical point is that not every loss appears in a report. Three minutes before an important presentation may seem insignificant, but in the right context, those three minutes can mean a disrupted meeting, missing information, a delayed proposal, or even a lost business opportunity.
Application performance issues do not affect only internal workflows. Once they affect the customer experience, the cost is no longer purely operational.
The Invisible Cost of Daily Digital Friction
Digital friction is anything that makes it harder, slower, or more disruptive for employees to interact with the technology they rely on to work.
It may be an application that takes too long to open, a system that freezes at certain times, an unstable VPN connection, an underperforming laptop, authentication failures, a screen that requires constant refreshing, or an online meeting that deteriorates because the connection cannot reliably support collaboration.
Individually, each situation may seem minor. Together, they consume hours of productive time, break concentration, increase rework, and erode employees’ trust in corporate technology.
This cost often remains invisible because these issues rarely become formal support tickets. Employees learn to work around them: they restart their computers, try again, switch networks, ask a colleague for help, or postpone the task.
From an IT metrics perspective, nothing significant may appear to have happened. From an operational perspective, however, productivity has already been affected.
The risk lies precisely in this visibility gap. Without digital experience data, IT may prioritize only highly visible incidents while recurring performance issues continue affecting critical areas of the business without ever appearing urgent enough on traditional dashboards.
Operational maturity begins when an organization can identify these points of friction before their impact accumulates.
“The System Is Slow” Is a Symptom, Not a Diagnosis
When users report that a system is slow, they are describing an experience—not identifying a root cause. IT’s challenge is to translate that experience into actionable technical data.
The investigation should go beyond determining whether the application is online. IT needs to understand where, when, for whom, and under what conditions the performance degradation occurs. It needs visibility into the actual end-user experience.
Several questions can help move the investigation beyond generic complaints and toward the source of the bottleneck:
- Does the performance issue affect all users or only a specific group? If it affects a broad range of users, the application or shared infrastructure may be involved. If it affects only certain groups, factors such as endpoints, access profiles, or location should also be investigated.
- Does it occur at a specific branch or location? If the issue is concentrated in one site, local connectivity or regional infrastructure may be contributing factors.
- Does it worsen during peak hours? Performance degradation during periods of high demand may indicate capacity constraints in the application, infrastructure, or network.
- Is it related to remote access? If the issue disproportionately affects remote employees, IT should investigate VPN performance, authentication processes, external network conditions, and other remote access dependencies.
- Does it happen only on certain endpoints? If only specific laptops or desktops experience poor performance, endpoint configuration, hardware resources, software conditions, or device lifecycle may be contributing factors.
- Did it begin after a recent update or configuration change? New application releases, operating system updates, security policies, or configuration changes may correlate with the issue.
- Is the problem limited to one application or present across multiple tools? A single affected application may indicate an application-specific issue, while degradation across several tools may point to endpoint, network, or access-related factors.
- Are there recurring complaints despite no formal tickets? Repeated informal complaints can reveal persistent issues that traditional support metrics fail to capture.
These questions help distinguish isolated perceptions from broader operational patterns without jumping to premature conclusions. Not every delay originates in the application, not every issue is network-related, not every complaint results from user behavior, and not every bottleneck requires additional infrastructure capacity.
Without the right data, IT risks addressing the wrong symptom.
With greater visibility, the team can investigate root causes more accurately and make informed decisions—whether that means adjusting capacity, reviewing permissions, refining configurations, upgrading endpoints, helping users, or escalating issues to technology vendors.
How to Identify Performance Bottlenecks Before They Impact Operations
Identifying performance bottlenecks requires making digital experience part of core IT management. This means monitoring the end-to-end user experience—from endpoint to application—and correlating technical telemetry with actual operational impact.
Signals That Demand IT’s Attention:
- Long device boot times
- Slow loading times in corporate applications
- Recurring access or authentication failures
- Instability in remote connections
- Performance degradation affecting specific user profiles
- Location-specific performance issues
- Recurring informal complaints without formal ticket creation
- Increased rework in digital workflows
- Low adoption of critical tools due to usability or performance issues
These indicators do not replace traditional monitoring. They add operational context to the technical view.
With this additional visibility, IT can more easily determine whether a bottleneck originates in the application, network, endpoint, remote access layer, or the way tools and workflows are being used.
It also enables IT teams to act before issues reach the customer, disrupt critical meetings, or compromise key business outcomes.
Frequently Asked Questions About Corporate System Slowness
- Why do corporate systems slow down even when there is no apparent downtime?
Because performance issues do not always result from a complete outage. They may originate in the application, network, endpoint, remote access environment, or usage patterns—factors that traditional availability monitoring may not fully capture.
- What is the impact of corporate application slowness on productivity and revenue?
Poor application performance can slow negotiations, increase customer response times, delay approvals, and make it harder for decision-makers to access critical information. In high-stakes situations such as an important presentation or sales pitch, even a few minutes of poor performance can put a business opportunity at risk.
- How can IT identify performance bottlenecks before they affect operations?
By monitoring indicators such as device boot times, application loading delays, access failures, performance degradation, and recurring informal complaints, then correlating this telemetry with actual end-user experience instead of relying solely on technical uptime.
The Performance Issues IT Misses May Be the Ones Operations Feels Most
When IT focuses only on technical availability, a critical part of the employee experience remains outside the diagnostic picture.
Advancing operational maturity means gaining the visibility needed to determine whether a bottleneck lies in the application, network, endpoint, remote access layer, or digital workflow.
Altasnet supports organizations on this journey by expanding visibility into the digital experience, helping identify the source of performance bottlenecks, and enabling a more proactive approach to IT operations.
Discover how Altasnet can help your IT team identify performance bottlenecks before they disrupt operations.